
Performance auditing using Chrome Dev Tools, Web Page Test and Page Speed Insight
Although Chrome Dev Tools gives us an approximation of what a connection would be like in a given device it's not 100% accurate, it can't be since our Macbooks and Windows devices don't have to deal with the additional constraints that a mobile device has.
Why should we test in an actual device? #
All cores in a laptop or desktop systems are symmetric as opposed to mobile devices where some of the cores are powerful and some of the cores (the ones that happen to do all of the work) are less powerful, use less power and generate less heat.
All laptops and desktops have large heat sinks over the CPU and fans (or liquid systems for some gaming rigs) to dissipate the heat. Mobile devices have no such things, that's why we're always concerned about burning ourselves with mobile devices.
Best explanation on how this affects performance and why we should care is Alex Russell's presentation at the Polymer Summit
So we have unreliable hardware (we can't tell if the right CPU cores will be ready when the user first access an application) in a flat out hostile network with high RTT that, potentially, takes a long time to actually complete.
The graphic below shows the HTTP Archive Trend for Average number of requests for Javascript resources and the average size of all responses for a single website between November, 2015 and November, 2016. HTTP Archive only deals with resources as they are transferred through the wire.
JS Transfer Size and Average # of Requests from HTTP Archive
If we accept that the default Dev Tools emulation in Chrome Desktop is not a faithful representation of how a site will load in a mobile device. We can create custom profiles and adjust the latency for each of our connections we cannot account for the unpredictability of mobile networks.
In the rest of the post we'll look at 3 tools that will allow us to get a better read on how our application is performing:
- Chrome Remote Debugging
- Page Speed Test to run your app closer to where your users are
- Page Speed Insight to get feedback and metrics on your app performance
Using Chrome Remote Debugging #
If you use Android, you can plug your device and run your app on the device to trace your app's performance in an actual mobile device using your desktop's Dev Tools. This will eliminate some of the issues Alex discussed on the video above. Running remotely through Dev Tools using the device will use the devices cell or wifi connectivity and will fire the device's cores as it would when working independently of the computer it's tethered to.
Because we can't rely on the results from simulating connection speed using desktop Chrome's Dev Tools this will produce a much more accurate Dev Tools trace of your application. The trace can be opened in other instances of Chrome for review and further analysis.
Chrome Dev Tools Remote Debugger describes how to plug in your Android device and use your desktop Chrome Dev Tools to create traces and debug your application.
In the video below Boris Smus shows how to remote debug an application on your mobile device using Desktop Chrome.
Using WebPage Speed Test #
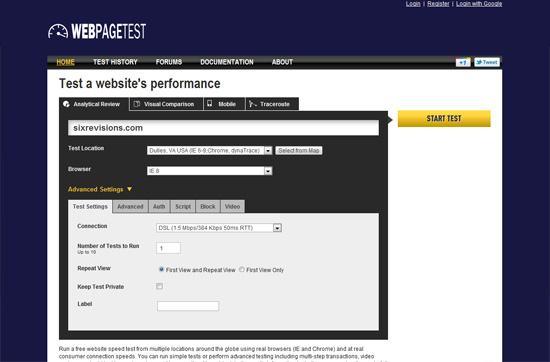
Webpage Speed Test provides tools to test your application in the same geographical location you expect your users to be. Depending on the region you will have different browsers and devices to test with.
If using Chrome (any version) you can generate trace of the test Pagespeed test runs. These tests can be imported into other instances of Chrome or Chromium-based browser and used for collaborative debugging and performance analysis.
Using Page Speed Insight #

Page Speed Insights works slightly different than WPST. It runs tests against the given website but instead of providing metrics and statistics it provides suggestions and solutions for improving the page load speed. A score of 85 or higher (out of 100) indicates that the page is performing well and, of course, the higher the score the better.
- time to above-the-fold load: How long does it take to load the content the user sees when she first loads the site/app
- time to full page load: How long does it take for the browser to fully render the page
Network performance is a tricky thing and can vary considerably between browsers, devices and networks. Because of this PageSpeed Insights only considers the network-independent aspects of page performance: the server configuration, the HTML structure of a page, and its use of external resources such as images, JavaScript, and CSS. The results will vary according to your network.
PWA auditing with Lighthouse #
Progressive Web Applications describe a set of technologies that make web applications look and behave like native applications without sacrificing the ease of authoring and the tools we use to create our apps.
There are many things that go into making a PWA and it's extremely hard to keep everything in mind as you're developin and testing your content. That's where Lighthouse comes in.
Lighthouse is a tool developed by Google's Chrome Team to detect and measure features of PWAs, provide best practices and performance advice for your application.
Lighthouse is available as a chrome extension 
and as a Node-CLI tool.

Install Lighthouse #
You can find instructions for installing Lighthouse, both the Chrome Extension and the CLI in the Github Repository README file.