Measuring your site's performance with Lighthouse
As developers, we are fixated with performance and rightly so. But we also tend to put web performance in a vacuum and not worry how our site's performance got to where it is today.
In this post, we'll talk about using Chrome DevTools to measure performance using Lighthouse from the Audits panel.
The idea is that, through testing, you'll get actionable items to fix for performance improvement as you start and later you can measure the impact of specific loading strategies and pieces of your content.
Warning: Make sure that you run the test in Incognito Mode create a blank Chrome profile just for testing. This will prevent extensions from interfering with the results of the test.
Lighthouse Audits #
The first thing we should do when looking at getting reports from DevTools is to use the built-in Lighthouse reports from the Audits panel.
We run Limelight first because we get more immediately actionable results from Lighthouse than we do from the other panels. Both Network and performance require deeper analysis and knowledge.
To launch the Lighthouse audit
- Make sure that you are running in Incognito Mode to prevent extensions from causing any problems
- Open DevTools (Command + Option + I on Macintosh or Control + Shift + I or F12 on Windows)
- Go to the Audits tab
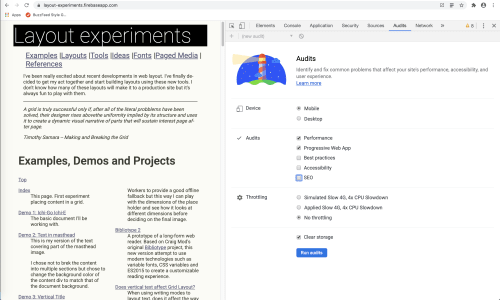
You will see something similar to the image below.

Lighthouse offers 4 areas of configuration:
- Device: Either mobile or desktop
- Audits: What audits to run. You can run one or more of these at the same times. The audits are:
- Performance measures different performance aspects of the page you're testing
- PWA checks if different components of a PWA
- Best Practices evaluates different best practices in front end web development
- Accessibility uses Axe Core to do automated evaluation testing. It is impossible to do complete accessibility evaluation programmatically, there will be plenty of things you will have to check manually
- SEO
- Throttling: Whether to throttle the connection for the tests or not
- There is a checkbox right above the
Run Auditbutton for clearing the browser storage. It is not checked by default
For this example we will run the audit with the following configuration:
- Mobile Device
- Performance
- No Throttling
- Clear Cache checked
Once the configuration is set click the blue Run Audit button.
The results #
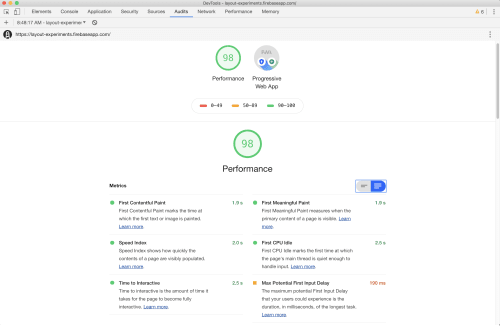
Lighthouse rates every category but PWA on a scale of 0 to 100 with higher values being better. Our example page scored 98 in the performance category. Let's look at specifics.
The top of the performance section repeats the score and it gives you basic metrics for the run on your page.

The performance metrics Lighthouse reports are:
- First Contentful Paint: Marks the time at which the first text or image is painted
- Speed Index shows how quickly the contents of a page are visibly populated
- Time to Interactive is the amount of time it takes for the page to become fully interactive
- First Meaningful Paint measures when the primary content of a page is visible
- First CPU Idle marks the first time at which the page's main thread is quiet enough to handle input
- Max Potential First Input Delay that your users could experience is the duration, in milliseconds, of the longest task

The next part of the screen shows a filmstrip of the loading of the page. From left to right it'll show the different stages of the loading process. The fewer empty frames you have, the faster the page loads.
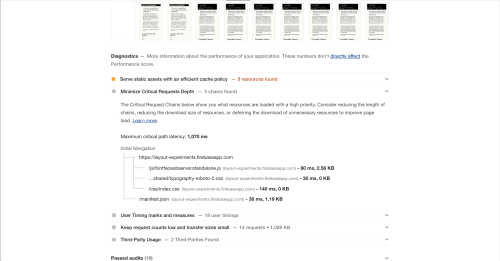
The last two portions of the performance section show opportunities, things we can manually change to improve performance and diagnostics, things about our site that might help improve performance but are primarily informational at this point.
For our example site, there are two opportunities: Removing Render Blocking Resources, in this case, stylesheets that can be inlined, and Reducing the server response times.
Your results will be different based on your content, how it's structured and what changes are you willing to make to get your site to load faster.
Final Notes #
The first time you run Lighthouse, make sure to save the results to use as your baseline for later comparison. This way, when you run the tests after making changes, you will have concrete numbers to measure, not just subjective impressions.
Test both on mobile and desktop. I worry more about mobile performance but that doesn't mean that we should throw desktop aside.
Throttle the connection before your test. While this is nowhere close to testing in an actual device (always preferred), it will give you a closer approximation to what your users will see when visiting your site.
