
Getting into a performance mindset
Web performance is hard. There is no one size fits all solution and the amount of work we do to make our content performant is more than what we may want to do. This post will explore the process of creating and enforcing a performance budget, why it's important and how will this improve the bottom line.
The following figures show how much stuff measured by the median number of requests and size in kilobytes have grown in a 3-year period from 2016 to March 2019 (data is taken from the HTTP Archive's state of the web report).
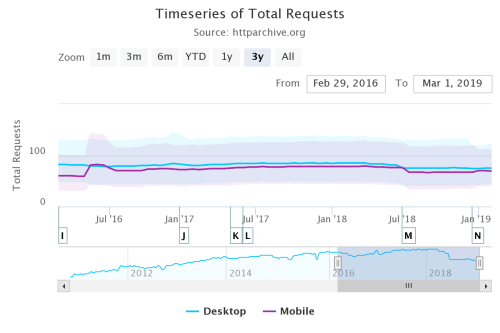
Timeseries of median total requests over a 3 year period
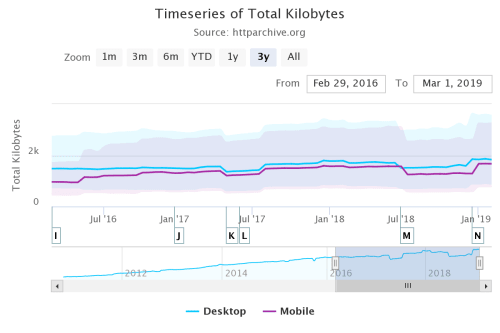
Timeseries of total kilobytes over a 3 year period
The technical aspects are not the only things that matter. We need to get buy-in from management and prepare for a large round of researching the competition and what makes sense for your company and your team.
Perhaps the best way to convince non-technical staff that performance is important and it matters is by reminding them that we leave money on the table if our site is slow or if the competitors' sites are faster.
You can improve conversion by improving performance and, conversely, you can lose users with a poor performing site:
- The BBC found they lost an additional 10% of users for every additional second their site took to load.
- DoubleClick by Google found 53% of mobile site visits were abandoned if a page took longer than 3 seconds to load.
Building the budget #
We have a rationale as to why we want to work on performance now we'll get serious about creating the performance budget and enforcing it during development. Some of the sources I'm using to write this post include
- Addy Osmani and
- Lara Hogan
- Smashing Magazine's Front-End Performance Checklist 2019
Tools like Performance Budget Calculator, Performance Budget Builder and Browser Calories can help in building the budget once we figure out what a budget is and decide that we want to use one for our project.
Understanding your users #
The first thing to do is figure out who your users are and how they are accessing your content, and that of your competitors to get an idea of what will it take to become faster and have a performant site.
Decide what you're measuring #
Pick what it is that you want to measure based on your research then get to it. Items you test may include results from specific tools (WPT or Lighthouse) or how long does it take for a step of the process to complete (time to first byte or time to interactive).
Some of the things you may want to measure:
- Loading speeds for different parts of the site on desktop and mobile
- first versus second and third visits
- Additional measurements you can get from Webpage Test
- Time to first byte on mobile versus desktop
- Load Time
- First Byte
- Start Render
- Visually Complete
- Speed Index
- Additional metrics from lighthouse runs
- First Contentful Paint
- Time to Interactive
- First Meaningful Paint
- First CPU Idle
Make sure that when you run the tests on both mobile and desktop and document the settings so you can repeat the tests as you change things. Ideally, also save the archive file (.har extension) that the tools provide so you can compare before and after any changes.
Always test on a device either locally or through testing labs that provide real devices. No matter how good a mobile simulator is there are things it can't do... All desktop machines use symmetrical multiprocessors as opposed to the asymmetrical setup of mobile devices, among other things.
Use analytics to determine what devices and browsers are visiting your site. When testing, set up a clean browser profile in addition to a typical user profile with the most common browser extensions.
Also, make sure that you test the competition's sites in terms of performance. Use the same metrics that you test your site with on your competitors'.
Once you have the performance data for your site and those of your competitors you can set up your budget. The common wisdom about performance budgets is to be 20% faster than your competitors.
Note: Differences between mobile and desktop #
It's not just the network time that'll kill your app's startup performance, but the time spent parsing and evaluating your script, during which time the browser becomes completely unresponsive.
On mobile, delays get compounded by additional tasks the device has to perform before it gets your data to the browser for it to render. Those milliseconds rack up very quickly.
See this presentation from Alex Rusell to get a better understanding of the challenges of the mobile web. It's from 2016 but the underlying principles have not changed.
A (theoretical) set of budgets #
The first set of budgets we get from running the pages on the site through Webpagetest.
| Measure | Maximum | Tool | Notes | | --* | --* | --* | --* | | Total page load time | 3 seconds | WebPagetest, median from five runs on 3G | All pages | | Total page load time | 3 seconds | Real user monitoring tool, median across geographies | All pages | | Total page weight | 800 KB | WebPagetest | All pages | | Speed Index | 1,000 | WebPagetest using Dulles location in Chrome on 3G | All pages except home page | | Speed Index | 600 | WebPagetest using Dulles location in Chrome on 3G | Home page |
We can get additional information from running Lighthouse from Chrome's developer tools (Audit menu)
| Measure | Minimum | Tool | | --* | --* | --* | | Performance | 95 | Lighthouse, desktop, no throttle, running in the browser with user profile | | Performance | 80 | Lighthouse, mobile, slow 3G throttle, running in the browser with a user profile. Score different accounts for additional costs of mobile web browsing |
We can set up a final set of budgets based on Webpackk bundles
| Measure | Maximum | Tool | Notes | | --* | --* | --* | --* | | Bundle size | 170KB | Webpack | Main Bundle |
It's important to remember: these are example metrics based on imaginary results from researching my company and the competition. Your research will almost certainly yield different results and produce different budget needs.
When we build the content it's easy to just build all aspects of the site and assume that, because we've minimized and bundled the code, everything will be fine... but that's not necessarily the case.
The first step in figuring out how to build a performant application is to inventory all assets (Javascript, images, fonts, third-party scripts and any other type of content for your site or app), and break them in groups:
- Basic core experience: fully accessible content that works for all your target users regardless of browsers and versions
- Enhanced experience an enhanced experience for browsers that support them
- Extras: "Nice to have assets" that aren’t absolutely required and that can be lazy-loaded.
Defining the browsers that will get the enhanced experience can be a little tricky as cutting the mustard for new features can be more complicated than it looks. While all the browsers that support ES2015+ modules support other features in the newer ECMA Script specifications, the reverse is not true. We might find ourselves trying to use modules and fetch in browsers that only support fetch.
If you can get away with it use ES2015+ <script type="module"> for loading JavaScript:
- Modern browsers will interpret the script as a JavaScript module and run it as expected.
- Legacy browsers will ignore the module script because it won't recognize the type attribute
Caveat: Android phones cut the mustard despite their limited memory and CPU capabilities. One way to work around this is to feature detect the Device Memory API first and fall back to cutting the mustard.
Keeping ourselves honest #
Once we have the budget we need to enforce it.
We'll discuss some techniques to keep ourselves honest when working with our code to make sure that our code stays within the assigned budget.
How we address these performance requirements and how seriously we enforce them is up to us. But I see no other way to really to get out of this bloated mess we've turned our web applications into.
None of these tools and suggestions are "the one" true solution to performance improvement but, using them together, they can provide measurements and warnings for when we're running away from our budgets.
Detecting performance issues at build time #
There are several ways to monitor your code's performance during the build phase of your project
We will not discuss how to set up a Webpack build system. If you haven't done so already there are several guides that will walk you through the process. This assumes you're either building your Webpack configuration from scratch or modifying an existing one.
Webpack's built-in performance options give you the first line of defense by warning your team (or failing the build) if an asset or entry point goes over a specified size in bites.
module.exports = {
  //...
  performance: {
    maxAssetSize: 100000,
    maxEntrypointSize: 100000,
    hints: "warning"
  }
};
The values for the attributes are explained in the table below:
| Attribute | Default in bytes | Value in the example in bytes | Description | | --* | --* | --* | --* | | maxAssetSize | 250000 | 100000 | Maximum Value for individual assets | | maxEntrypointSize | 250000 | 100000 | Maximum Value for individual entry points | | hints | warning | warning | Values discussed below |
In this case, there’s only one bundle which also acts as the entry point.
Possible values for hints are:
- warning (default): Displays a yellow warning message, but the build passes. It’s best to use this in development environments.
- error: Displays a red error message, but the build still passes. This setting is recommended for production builds.
- false: No warnings or errors are shown.
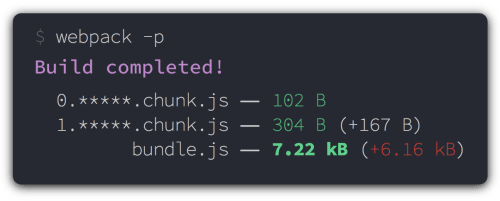
As a second warning/error stage, Webpack's size-plugin reports on each bundle size and whether the size as changed since the last time the command was run.
To use the plugin, first install it using NPM:
npm i -D size-pluginThen add it to your configuration file in two steps. First import the plugin
// load the size plugin
const SizePlugin = require('size-plugin');module.exports = {
plugins: [
new SizePlugin()
]
}Despite our best efforts in reducing bundle sizes and trimming our Javascript fat, we may still find out that our bundles are too large and we can't figure out where the extra size comes from.
One possibility is that we're loading too many dependencies that we don't need. Libraries like Lodash and Moment are the most often cited culprits because developers don't realize that they don't have to import the whole library but only the portions we need.
Webpack Bundler Analyzer produces a graphical visualization of the modules you app uses.
Bundle analyzer also gives you results for your compressed and minimized bundles. It presents three value for your bundles:
- stat
- This is the "input" size of your files, before any tansformations like minification.
- It is called "stat size" because it's obtained from Webpack's stats object.
- parsed
- This is the "output" size of your files. If you're using a Webpack plugin such as Uglify, then this value will reflect the minified size of your code.
- gzip
- This is the size of running the parsed bundles/modules through gzip compression.
Babel and babel-preset-env #
Transpiling ES2015+ to ES5 so it'll run on older browsers can create bloated bundles for browsers that don't need it. This is one of the reasons why the Babel team replaced the yearly plugins (ES2015, ES2016, ES2017) with a single plugin called babel-preset-env
Using the same lists as autoprefixer and other tools in the Javascript ecosystem babel-preset-env allows Webpack to only transpile those areas where the target browsers don't support modern Javascript.
This will reduce the size of your bundles but limit them to the browsers you choose in one of the following ways:
browserslistkey inpackage.jsonfile in current or parent directories. We recommend this way- Tool options. For example browsers option in Autoprefixer
BROWSERSLISTenvironment variablebrowserslistconfig file in current or parent directories..browserslistrcconfig file in current or parent directories.- If none of the above methods produce a valid result Browserslist will use these defaults:
> 0.5%, last 2 versions, Firefox ESR, not dead.
To run the plugin first install them. The example assumes that you've already installed Webpack for your project.
npm install -D babel-loader \
@babel/core \
@babel/runtime \
@babel/preset-env \
@babel/plugin-transform-runtime \
Using Webpack's bable-loader we can specify directories to exclude (we don't want to transpile all the files in node_modules and bower_components), and the plugins that we want to use: in this case preset_env and plugin-transform-runtime.
The transform-runtime plugin tells Babel to require the runtime instead of inlining it, reducing the amount of duplicate code in our bundles
The last thing to note is that the test for babel loader includes both .js and .mjs used by Node to identify ECMAScript modules and difference them from Common JS modules that are the default modules for the Node ecosystem.
rules: [
  {
    test: /\.m?js$/,
    exclude: /(node_modules|bower_components)/,
    use: {
      loader: 'babel-loader',
      options: {
        presets: ['@babel/preset-env'],
        plugins: ['@babel/plugin-transform-runtime']
      }
    }
  }
]
This gives you a lot of control over what you transpile for which browsers and help reduce bundle sizes by eliminating unnecessary transpilation. However, it also makes you responsible for ensuring your audience can use the code and doesn't have to rely on polyfills or graceful degradation if possible.
Measuring performance #
Just like we ran tests to establish our budgets we have to continue running them to make sure we stay within that budget and we don't introduce any performance regressions.
The first idea when it comes to keeping ourselves honest is to make sure that we run the performance tests that we want every time we build our project or whenever we accept a new PR for it.
Webpage Test using the webpagetest-api wrapper automates Webpage tests. You can run it from the command line, through a build script, or as part of your CI process
Lighthouse makes Lighthouse reporting part of a Travis CI process and also gives you an integration with Github PRs so they can be evaluated for performance.
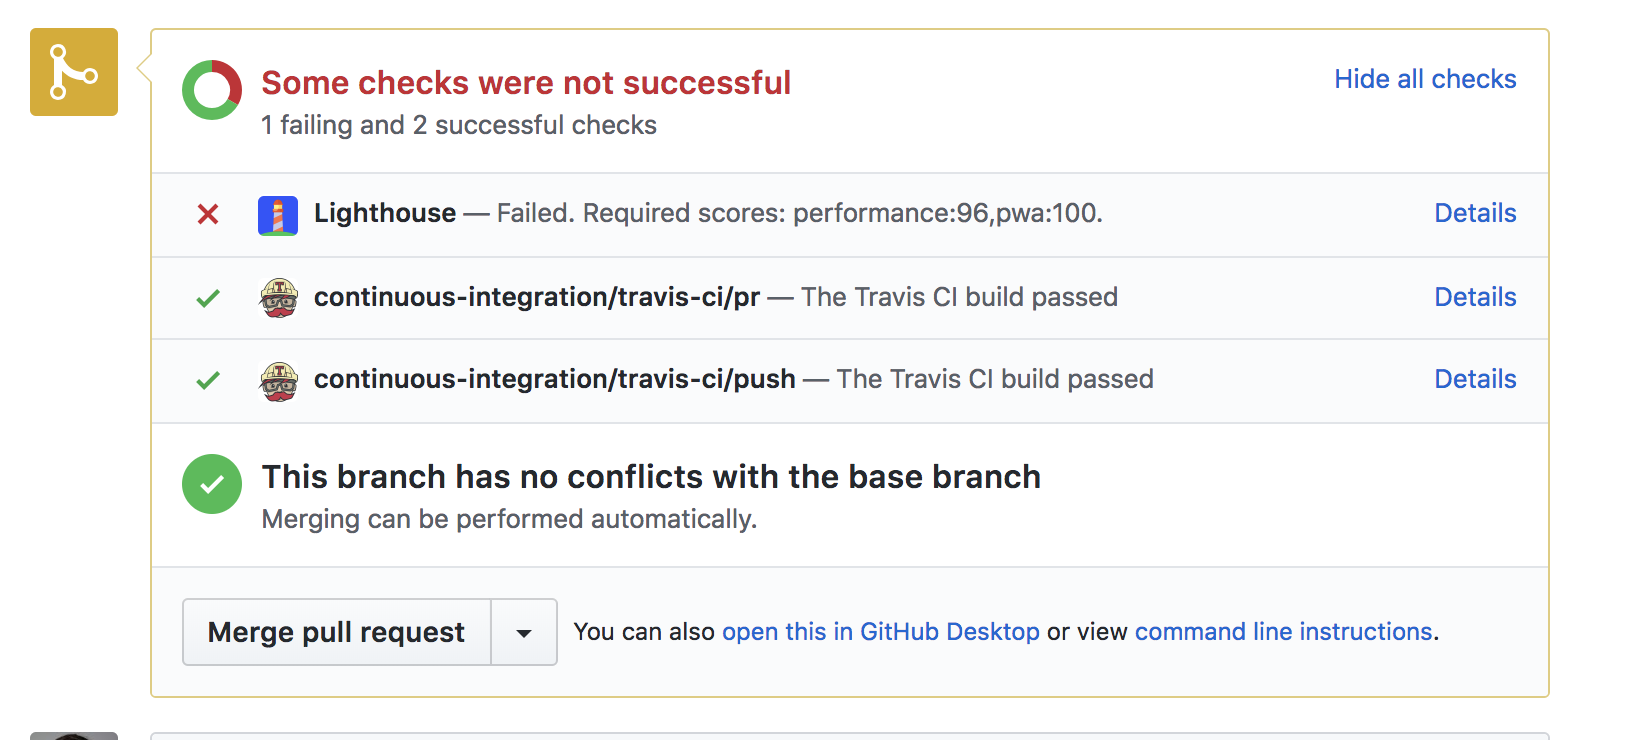
Both of these tools give you performance visibility during the build process. If these either of these tools fails the results will be reflected in the PR and they can reject the PR automatically or let project owners take manual action on the request.
Dashboards and reporting #
Tools like Calibre and Speedcurve allow you to create dashboards to show the results of performance testing.
The idea is to first surface performance for the whole team to see and to have a clear way to communicate to interested parties when a performance regression happens so you can take appropriate action.
One thing that I found particularly interesting is how Speed Curve and Calibre allow you to create competitive dashboards of your company against the competition you select.

Comparative performance dashboard from Speedcurve
