
Chrome DevTools Network Tab
The idea is that using this tab we can check how our page loading and troubleshoot loading issues as they happen with a visual representation of the loading process
- Make sure that you are running in Incognito Mode to prevent extensions from causing any problems
- Open DevTools (Command + Option + I on Macintosh or Control + Shift + I or F12 on Windows)
- Go to the Network tab
The image below shows the result of running the Network tab in Chrome 78 (Canary when the article was written).
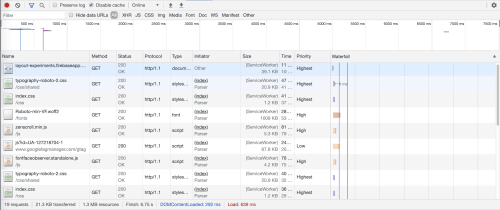
The Network panel provides the following information for every resource loaded for the page:
- Method: HTTP method used to retrieve the resource; usually GET
- Status: The status code for the response. Usually 200 for successful responses.
- Protocol: The HTTP protocol of the server handling the request
- Type: What type of resource it is expressed by mime type
- Initiator: What triggered the loading of the resource
- Size: How big the resource is
- Time: How long did it take to load the resource
- Priority: The priority the browser used to fetch the resource
- Waterfall: shows different time metrics for the resource. We'll revisit the waterfall in a later section
Things we can do #
There are some additional things that we can do when in the network panel.
If we Disable Cache we will get a fresh download without pulling data from the cache, just like a user visiting the site for the first time.
Online is a pull-down menu that gives us the option to throttle our connection speed to one of the available presets or to customize the way the connection behaves.
The two arrows in the far right allow you to import (arrow pointing up) and export (arrow pointing down) HAR files, a cross-browser way to review performance data.

The result #
Below the waterfall, we get several aggregate results for the page. These may give a first impression of why the page may be experiencing performance issues.
How many requests succeed and what's the total number of requests for the page if they are different.
How much storage do the resources you needed to download for the page cost in terms of weight.
How much did all the resources for the page cost in terms of bandwidth weight. This number may be different than the weight of transferred resources because it includes the resources that the browser cached in prior visits.
The final three numbers are indicators of speed. Going from right to left:
- finished indicates how long did the page take to load
- DOMContentLoaded shows how long did the browser take before firing the DOMContentLoaded event. The DOMContentLoaded event fires when the initial HTML document has been completely loaded and parsed, without waiting for subresources to finish loading
- Load shows how long did the browser takes to fire the load event. This event fires when the whole page has loaded, including all dependent resources such as stylesheets images

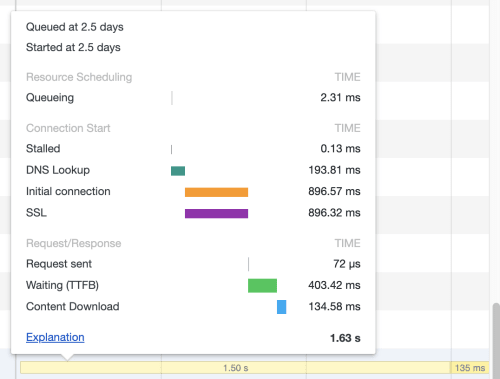
The waterfall in detail #
Rather than try to explain in detail what each possible element is, I'll use Google Developers' Network Analysis Reference section on Timing breakdown phases as an explanation:
- Queueing. The browser queues a request when:
- There are higher priority requests.
- There are already six TCP connections open for this origin, which is the limit. Applies to HTTP/1.0 and HTTP/1.1 only.
- The browser is briefly allocating space in the disk cache
- Stalled. The request could be stalled for any of the reasons described in Queueing.
- DNS Lookup. The browser is resolving the request's IP address.
- Proxy negotiation. The browser is negotiating the request with a proxy server.
- Request sent. The request is being sent.
- ServiceWorker Preparation. The browser is starting up the service worker.
- Request to ServiceWorker. The request is being sent to the service worker.
- Waiting (TTFB). The browser is waiting for the first byte of a response. TTFB stands for Time To First Byte. This timing includes 1 round trip of latency and the time the server took to prepare the response.
- Content Download. The browser is receiving the response.
- Receiving Push. The browser is receiving data for this response via HTTP/2 Server Push.
- Reading Push. The browser is reading the local data previously received.
This is not everything you can do in DevTools' network tab but it's a good starting point.