
Basic Performance Analysis (3) - Lighthouse
This post will explore what is Lighthouse, how to use Lighthouse in Chrome DevTools and Pagespeed Insights and some of its drawbacks and benefits.
What is Lighthouse? #
Lighthouse is an open-source, automated tool to help you improve the quality of web pages. You can run it on any web page, public or requiring authentication. It has audits for performance, accessibility, progressive web apps, SEO, and more.
It is available as a Chrome extension, a Node module, and a CLI tool. Lighthouse can be run in Chrome DevTools, from the command line, or as a Node module. It is also integrated into Google PageSpeed Insights, Chrome UX Report and PageSpeed Test.
In this post we'll focus on how to use Lighthouse in Chrome DevTools and as a Node.js CLI command, along with some observed issues when using the tool.
Chrome DevTools #
To use Lighthouse in Chrome DevTools, navigate to the page you want to test, open DevTools and do one of the following:
- Press
F12(Windows) - Type ⌃ + I (Windows)
- Type ⌘ + ⇧ + I (Mac)
- Right-click anywhere on the page and select
Inspect
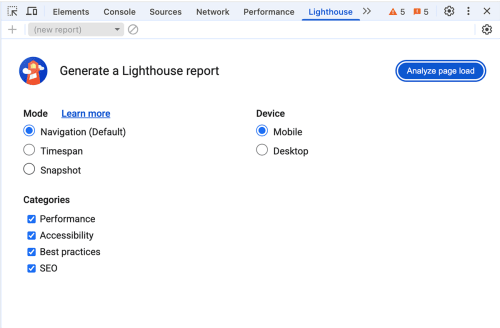
Once the DevTools are open, click on the Lighthouse tab. You will see the initial view, shown in Figure 1.
The default is to run all available audits in an (emulated) mobile device. You can change the audits to run, the device to use: desktop or mobile (the default), and the user flows that you want to run the tests under.
For this example, we'll use the defaults and run all tests in an emulated mobile device. Click on the Analyze page load button to start the tests.
When the test completes, you will see the first results, as shown in Figure 2. The results are divided into four categories: Performance, Accessibility, Best Practices, and SEO. Each category has a score, and you can click on the category to see more details.
Below the results summary we see detailed information about the performance tests run since it's the first category.
Next, it displays individual metrics that make up the performance score. There is an option to expand the metrics to see brief descriptions of each available metric.
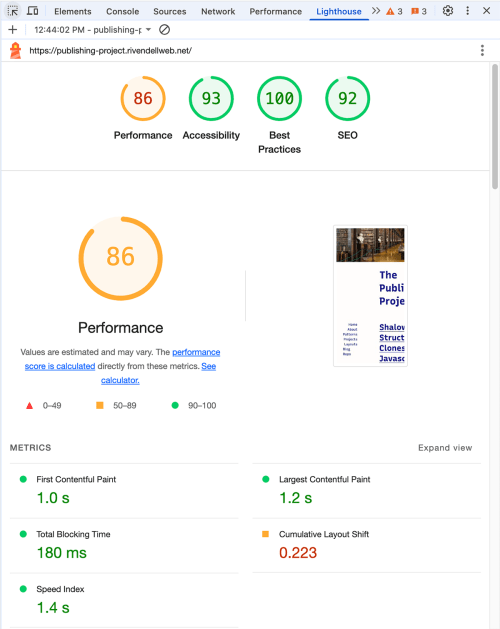
Figure 3 shows a film strip view of the site loading on the device used for the test, it will be different depending on whether it's a desktop of mobile emulation. This is followed by opportunities to improve the performance of the site. Each opportunity has a brief description, a link to learn more, and a button to see the details.
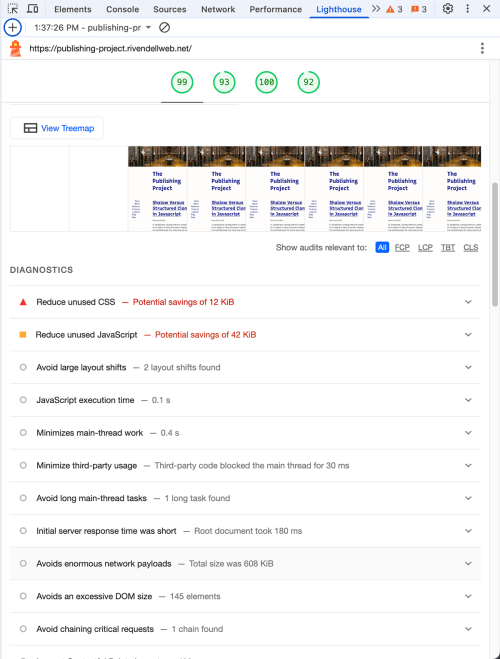
Figure 4 shows the desktop view of the Lighthouse tab in Chrome DevTools. The initial view is the same as the mobile view, but the results are different since the tests are run on a desktop device.
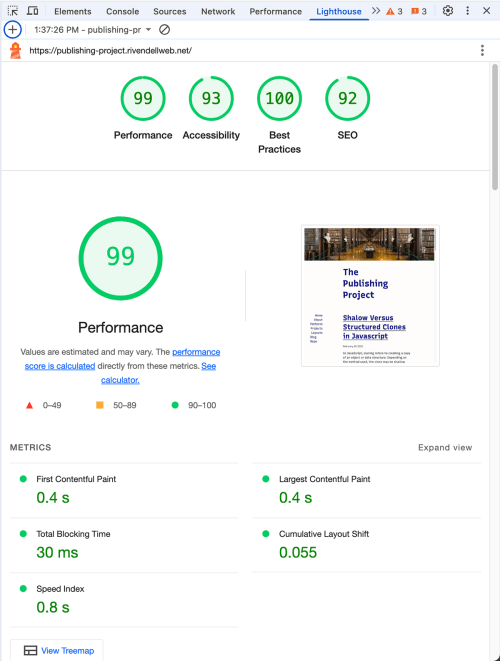
The results in the Accessibility, Best Practices, and SEO categories are likely to be the same since they are not affected by the device used for the test.
Running Lighthouse as a Node module #
It is also possible to run Lighthouse as a Node-based CLI application. This is useful when you want to automate the testing of multiple pages or sites.
The first step is to install Lighthouse globally.
npm install -g lighthouseThen you can run the command against a given website. the --view flag will open the generated report in the default browser.
lighthouse https://publishing-project.rivendellweb.net --viewAnother way to run Lighthouse is to use Lighthouse directly in your code.
This example uses the lighthouse and chrome-launcher NPM packages to run Lighthouse against a given URL and save the report to an HTML file.
import fs from 'node:fs';
import lighthouse from 'lighthouse';
import * as chromeLauncher from 'chrome-launcher';

const chrome = await chromeLauncher.launch({
	chromeFlags: ['--headless']
});

const options = {
	logLevel: 'info',
	output: 'html',
	onlyCategories: ['performance'],
	port: chrome.port
};

const runnerResult = await lighthouse(
	'https://publishing-project.rivendellweb.net',
	options
);

const reportHtml = runnerResult.report;
fs.writeFileSync(
	'lhreport.html',
	reportHtml
);

console.log('Report is done for', runnerResult.lhr.finalDisplayedUrl);
console.log('Performance score was', runnerResult.lhr.categories.performance.score * 100);

chrome.kill();
A future extension of this example could be to set the URL to test as a command line argument or to test multiple URLs in a loop.
Drawbacks and Benefits #
While Lighthouse provides a comprehensive set of tools to analyza a website's performance, it has some drawbacks.
Score volatility #
Lighthouse performance scores are not guaranteed to remain constant. Even when you run the same test on the same browsers, the performance values are not guaranteed to be the same.
When I ran lighthouse against the same site, the mobile performance score varied between 77 and 100 and the desktop score varied between 80 and 100 with the same browser and network connection.
The variability in the overall Performance score and metric values may not be due to Lighthouse. When your Performance score fluctuates it's usually because of changes in underlying conditions that include:
- A/B tests
- Changes in ads being served
- Internet traffic routing changes
- Browser extensions that inject JavaScript and add/modify network requests
- Antivirus software
Lighthouse's documentation on Variability covers this in more depth.
Saving Lighthouse data can also be problematic since it's not intuitive and the default format is HTML.
You can save the data as JSON (not the default) using the following command:
lighthouse https://publishing-project.rivendellweb.net \
--output json \
--output-path ./lighthouse.json
You can then use the Lighthouse Report Viewer to view the report.