
Basic Performance Analysis (2) - Core Web Vitals
Core Web Vitals are the subset of Web Vitals that apply to all web pages, should be measured by all site owners, and will be surfaced across all Google tools.
This post will explore Coree Web Vitals, what they are and how they can be improved
What are Core Web Vitals? #
Each of the Core Web Vitals represents a distinct facet of the user experience, is measurable in the field, and reflects the real-world experience of a critical user-centric outcome.
The metrics that make up Core Web Vitals will evolve over time. The current set focuses on three aspects of the user experience — loading, interactivity, and visual stability — and includes the following metrics (and their respective thresholds):
- Largest Contentful Paint (LCP)
- Reports the render time of the largest image, text block, or video visible in the viewport, relative to when the user first navigated to the page.
- To provide a good user experience, LCP should occur within 2.5 seconds of when the page first starts loading.
- Interaction to Next Paint (INP)
- Assesses a page's overall responsiveness to user interactions by observing the latency of all click, tap, and keyboard interactions that occur throughout the lifespan of a user's visit to a page. The final INP value is the longest interaction observed, ignoring outliers.
- To provide a good user experience, pages should have a INP of 200 milliseconds or less.
- Cumulative Layout Shift (CLS)
- CLS is a measure of the largest burst of layout shift scores for every unexpected layout shift that occurs during the entire lifecycle of a page. A layout shift occurs any time a visible element changes its position from one rendered frame to the next.
- To provide a good user experience, pages should maintain a CLS of 0.1. or less.
A good threshold to measure Core Web Vitals is the 75th percentile of page loads, segmented across mobile and desktop devices.
Measuring Core Web Vitals #
There are several ways to measure Core Web Vitals for your target website:
- Chrome DevTools
- PageSpeed Insights
- Core Web Vitals library
Some notes:
- Different tools may produce different results for the same URL. Keep this in mind when reviewing the results
- There are different Core Web Vitals tests for mobile and desktop. For a holistic view of your website's performance, you should test both
Chrome DevTools #
Under the performance tab, Chrome DevTools provides Core Web Vitals measurements. The examples in this section are based on Chrome (Canary) 134.
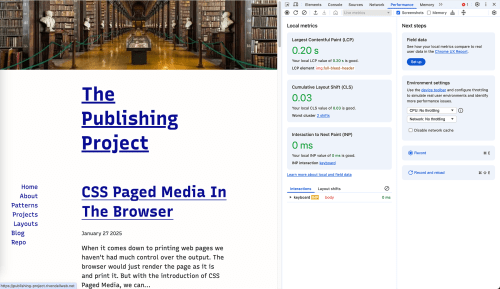
This tool will only record the Core Web Vitals metrics for the current page load. To preserve the data, you can export the data to a HAR file for later review and analysis.
PageSpeed Insights #
PageSpeed Insights (PSI) combines data from the Chrome User Experience Report (CrUX), Lighthouse (discussed in the next section) and Core Web Vitals to provide a better overview of a site's performance.
Some note about PSI:
- The CrUX data is based on real-world user data of those Chrome users who opt into data collection and is updated every 28 days.
- Because it's opt-in, not all sites may have CrUX data for mobile or desktop or any data at all
- The results are different for mobile and desktop devices
- My expectation is that desktop results will always be better
- The results are based on the 75th percentile of page loads
- Lighthouse results may be subject to network conditions
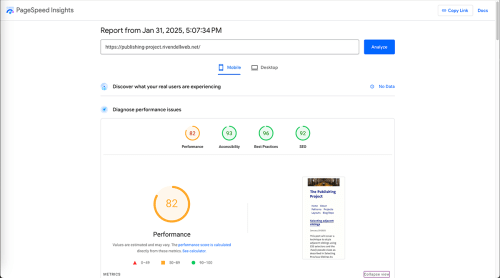
To work with PageSpeed Insights, enter the URL of the site you want to test and click the Analyze button.
The app will display the results for mobile and desktop devices, with mobile results displayed by default.
The mobile configuration is as follows:
- Data taken from a single page session
- Measure initial page load
- Emulation
- Device: Emulated Moto G Power
- Screen: 412x823, DPR 1.75
- Throttling (simulated)
- CPU: 1.2x slowdown
- Network: 150 ms TCP RTT, 1,638.4 kb/s throughput
- Browser
- Location: North America
- Version: Headless Chromium 131.0.6778.264
The Discover what your real users are experiencing section will display the CrUX data for the URL you entered and the type of device the tests are run for. Not all sites will contain CrUX data for mobile or desktop devices.
In the Diagnose performance issues section, the top row contains the Lighthouse results for the URL you entered.
- Performance
- Accessibility
- Best Practices
- SEO
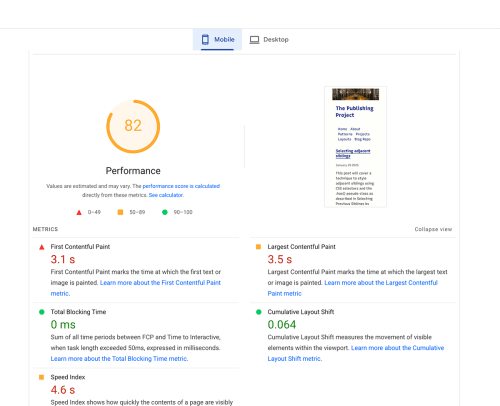
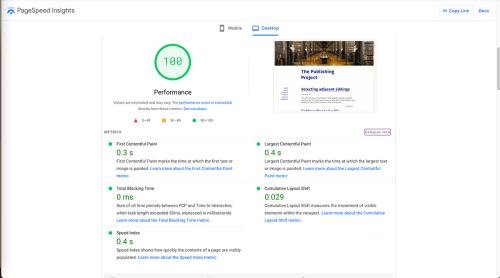
Next PSI displays the Performance analysis for the URL you entered on the left side and a screenshot of the website on the right.
Under the Performance test are the component metrics for the performance score. They include Core Web Vitals and additonal metrics:
- First Contentful Paint: Marks the time at which the first text or image is painted on screen
- Total Blocking Time: Sum of all time periods between FCP and Time to Interactive, when task length exceeded 50ms, expressed in milliseconds
- Speed Index: Shows how quickly the contents of a page are visibly populated. Learn more
- Largest Contentful Paint: Marks the time at which the largest text or image is painted
- Cumulative Layout Shift: Measures the movement of visible elements within the viewport
Differences between mobile and desktop results #
As mentioned earlier, the results for mobile and desktop devices will be different.
The desktop view for the site shows the CrUX data for desktop users and the Lighthouse data.
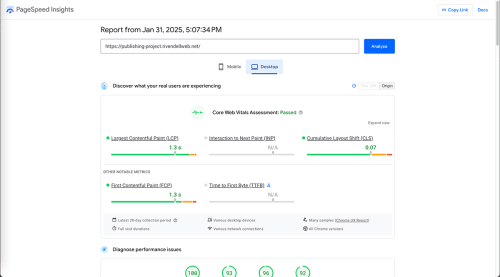
Figure 5 shows how the same metrics work for desktop users. This may be because of network conditions and hardware differences between mobile and desktop devices.
Using
Programmatic measurement #
There are times when you may want to measure your user's core web vitals directly from your website. We can do this with the web-vitals library.
The web-vitals library is a lightweight JavaScript library that measures all the Core Web Vitals metrics. It is a good way to measure the performance of your website without third-party libraries.
The sendToAnalytics() function uses the navigator.sendBeacon() method (if available), but falls back to the fetch() API when Beacon is not available.
The code assumes that you have an analytics endpoint (either remote or local) that accepts post requests
import {onCLS, onINP, onLCP} from 'web-vitals';

function sendToAnalytics(metric) {
  const body = JSON.stringify(metric);
  (navigator.sendBeacon && navigator.sendBeacon('/analytics', body)) ||
    fetch('/analytics', {body, method: 'POST', keepalive: true});
}

onCLS(sendToAnalytics);
onINP(sendToAnalytics);
onLCP(sendToAnalytics);
The following code snippet modifies the sendToAnalytics() function to send the data to a specific Google Analytics account.
import { onCLS, onINP, onLCP } from 'web-vitals';

const sendToAnalytics = ({ name, delta, id }) => {
  const roundedValue = Math.round(name === 'CLS' ? delta * 1000 : delta);

  window.gtag('event', 'web_vitals', {
    event_category: 'Web Vitals',
    event_label: id,
    value: roundedValue,
    metric_name: name,
    non_interaction: true,
  });
};

// Register the web-vital metric listeners.
onCLS(sendToAnalytics);
onINP(sendToAnalytics);
onLCP(sendToAnalytics);
The Google Analytics code makes the following additional assumptions:
- The GA4 snippet is loaded on the page. This will provide the
gtagfunction - GA4 expects metric values to be integers so the value is rounded
- For CLS the delta is multiplied by 1000 before rounding to preserve precision
- The event name
web_vitalsis used for all metrics- The custom parameter
metric_nameholds the actual metric name
- The custom parameter
- We use non-interaction events so these metrics don't affect bounce rate
The library gives you a granular view of the metrics, allowing you to measure individual metrics as they apply to your website and publish them as needed.